Dutch Retail Sales
A retail analytics case study focused on turning legacy sales reporting into a more reactive, decision-ready dashboard environment.
The page is structured for hiring managers: clear business problem, visual proof, technical architecture, and direct relevance to operational analytics work.
Focus: sales metrics modernization
Stack: SQL, Python, Tableau
Value: faster insight for business decisions
- Dashboard thinking tied to real business questions.
- Clear translation from raw metrics to executive visibility.
- Evidence of BI workflow design, not only analysis.
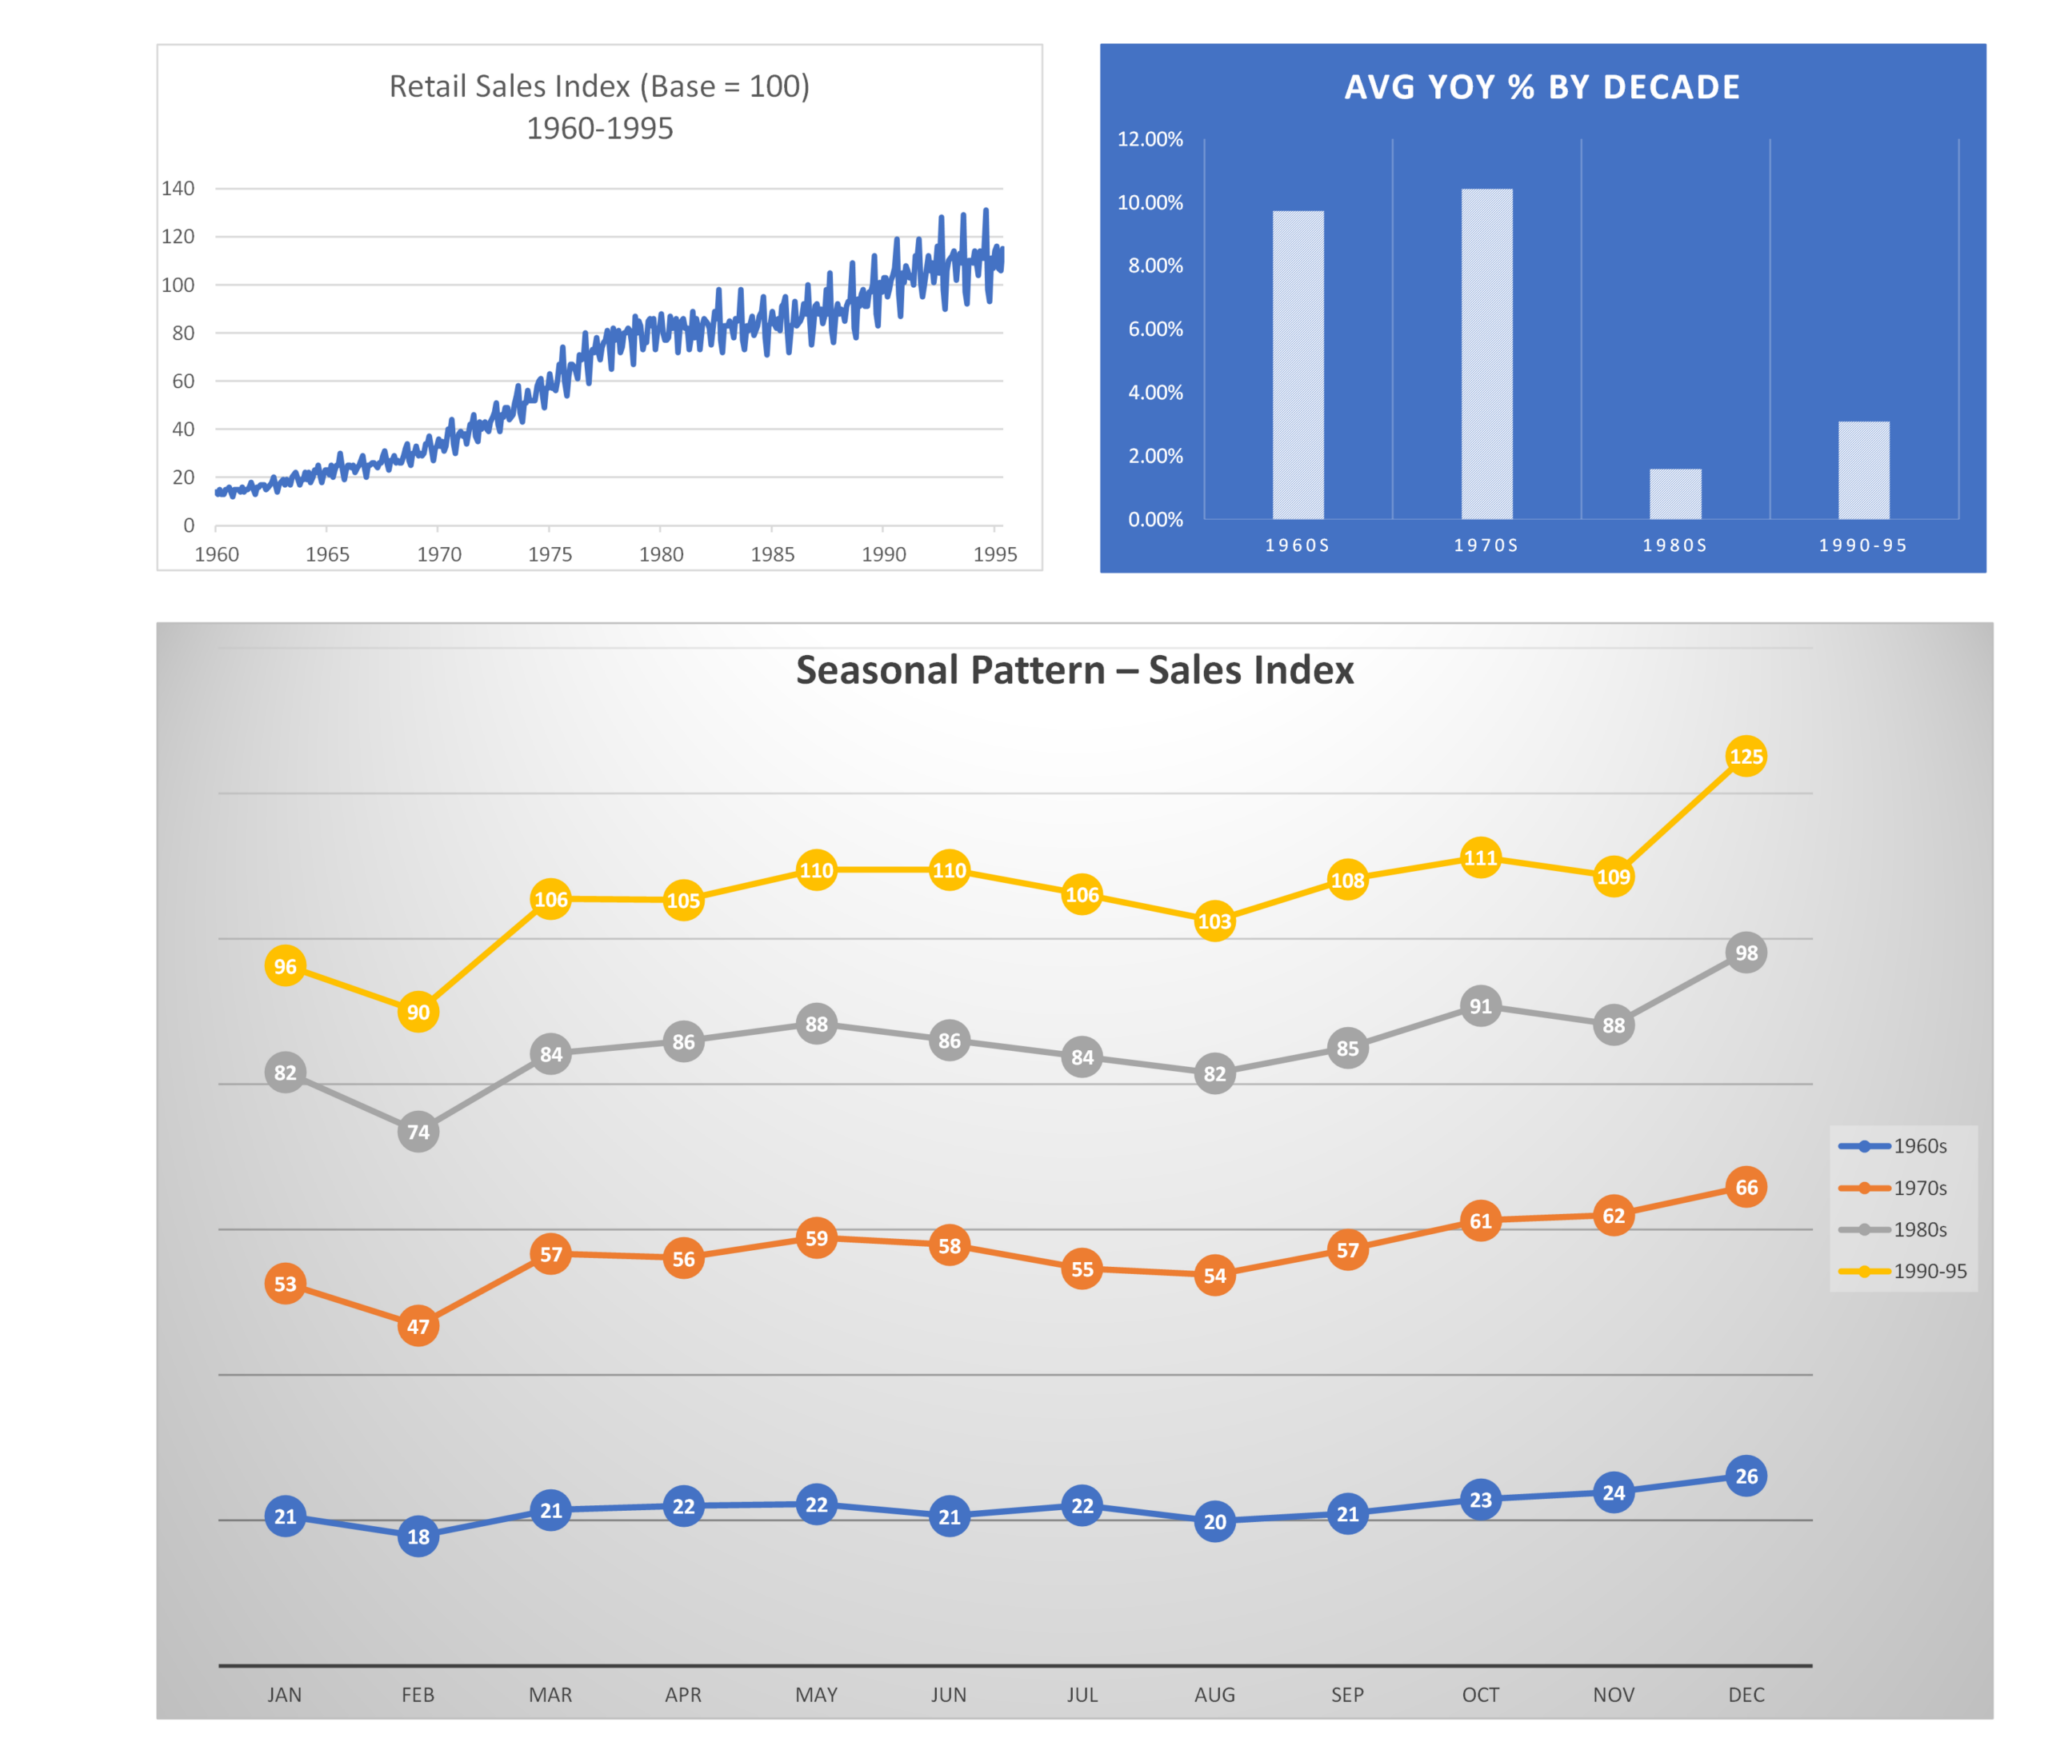
Dashboard Output
The core artifact is a retail sales dashboard built to surface business performance quickly, replacing slower and more fragmented review patterns.
How The Project Works
Data Pipeline
Structured source metrics into a cleaner reporting layer designed for repeatable business monitoring.
Analytical Logic
Used SQL and supporting automation to standardize measures and prepare them for BI consumption.
BI Delivery
Presented metrics in a dashboard format intended to shorten the path from question to decision.
Why This Matters
Moves reporting toward faster operational visibility.
Turns raw sales outputs into a cleaner business narrative.
Supports managers who need trend visibility without manual interpretation overhead.
Demonstrates BI thinking that transfers to healthcare operations and revenue cycle reporting.